LED action potential
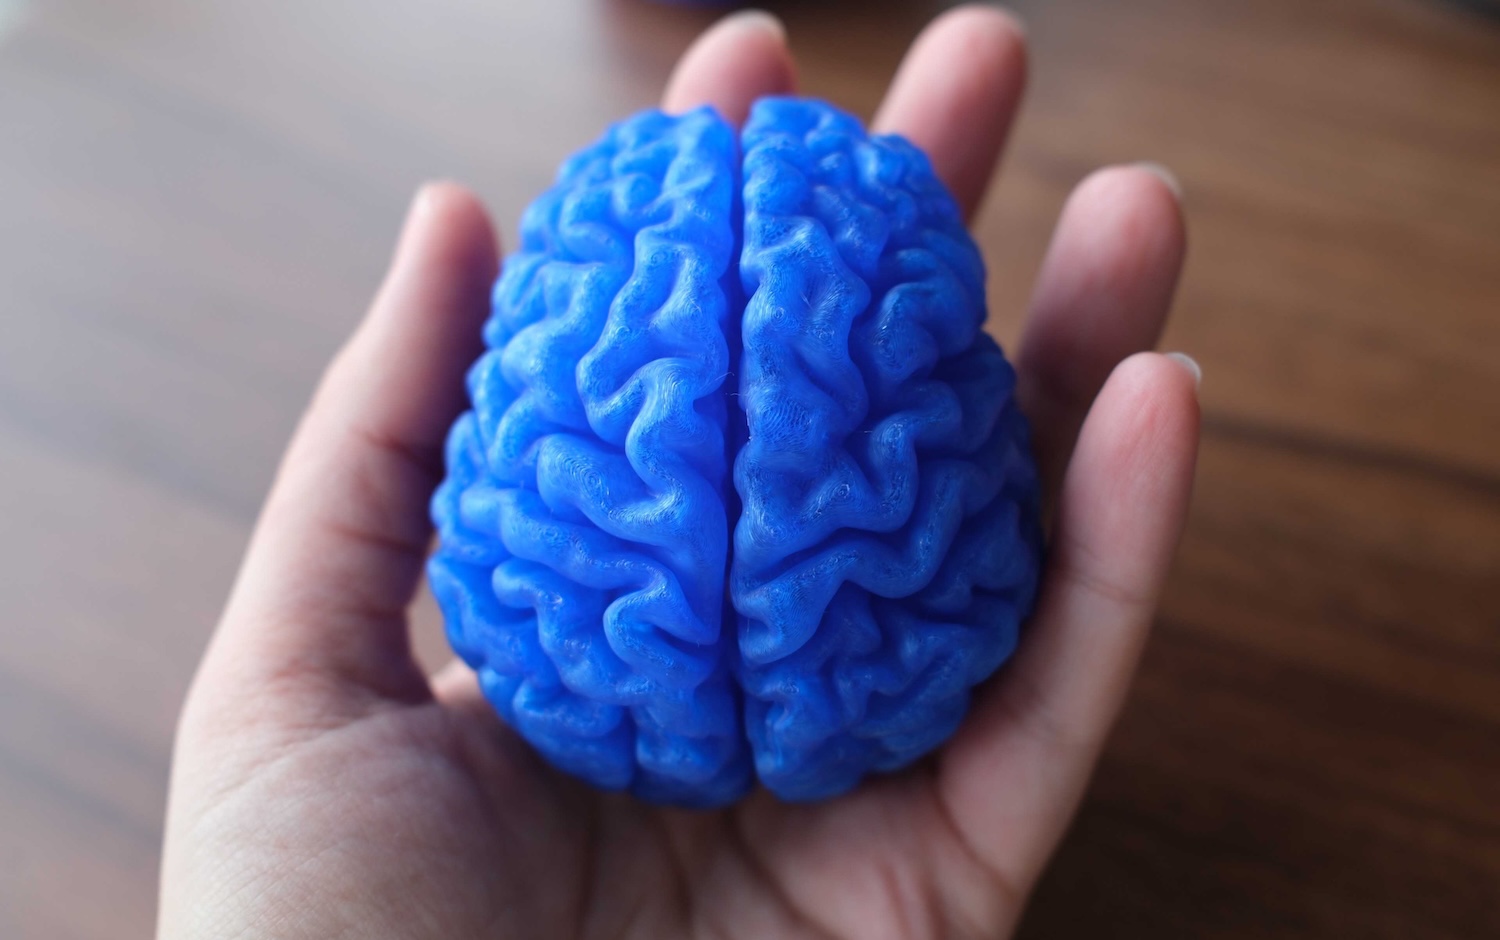
weekend project: built an LED action potential 💡
— Natalie Schaworonkow (@nschawor.bsky.social) May 4, 2026
weekend project: built an LED action potential 💡
— Natalie Schaworonkow (@nschawor.bsky.social) May 4, 2026
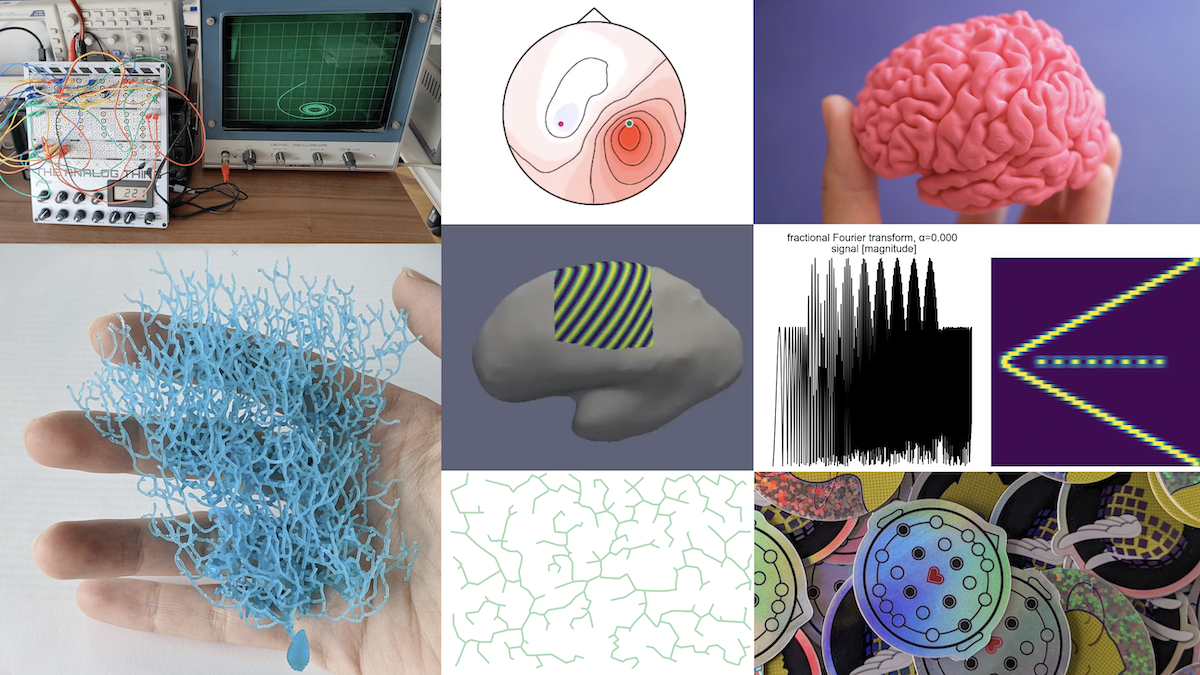
I created a few custom feeds for Bluesky based on regular expressions. If a post matches certain patterns, it will get added to the feed (so the occasional stray post appears also). Current feeds include:
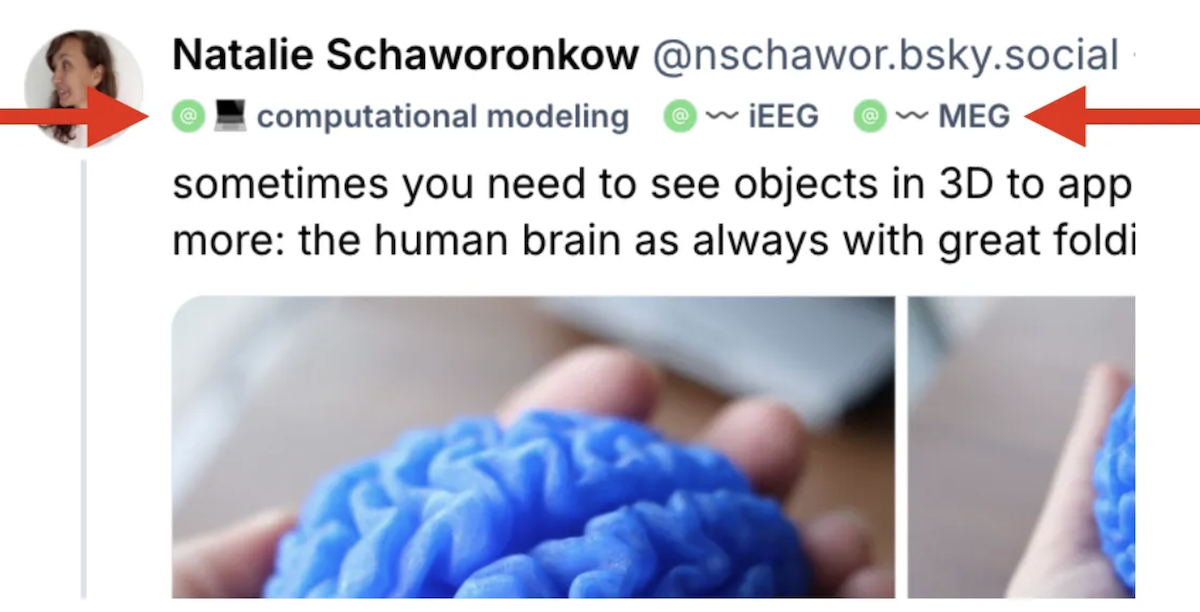
Also I played around with building a Bluesky labeler for neuroscience methods. Subscribe to: neuromethods.bsky.social and like the corresponding post to have a shiny methods label appear in your profile. People with specific method labels will be automatically added to method-specific starter packs, e.g. here is the EEG starter pack.
more MEG artefacts: the tram runs in ~200 meter distance from the MEG lab here. even though the MEG sensors are shielded by a few tons of metal, they still pick up the railway traction power signal (at 16.67 Hz in Germany), a demo of their high sensitivity.
— Natalie Schaworonkow (@nschawor.bsky.social) 10 April 2026 at 15:05
[image or embed]
artefacts in MEG: here, the participant forgot to remove a belt with a metal buckle. the buckle moves when breathing, introducing low frequency artefacts. taking off the belt solves resolves this. 🙂
— Natalie Schaworonkow (@nschawor.bsky.social) 25 March 2026 at 15:25
[image or embed]
I am interested in network effects in social media & post activity related to recent conferences may be an indicator of this.
Therefore, I counted Bluesky vs. X/Twitter posts mentioning #cosyne2026 hashtags, with more Bluesky posts this time around.
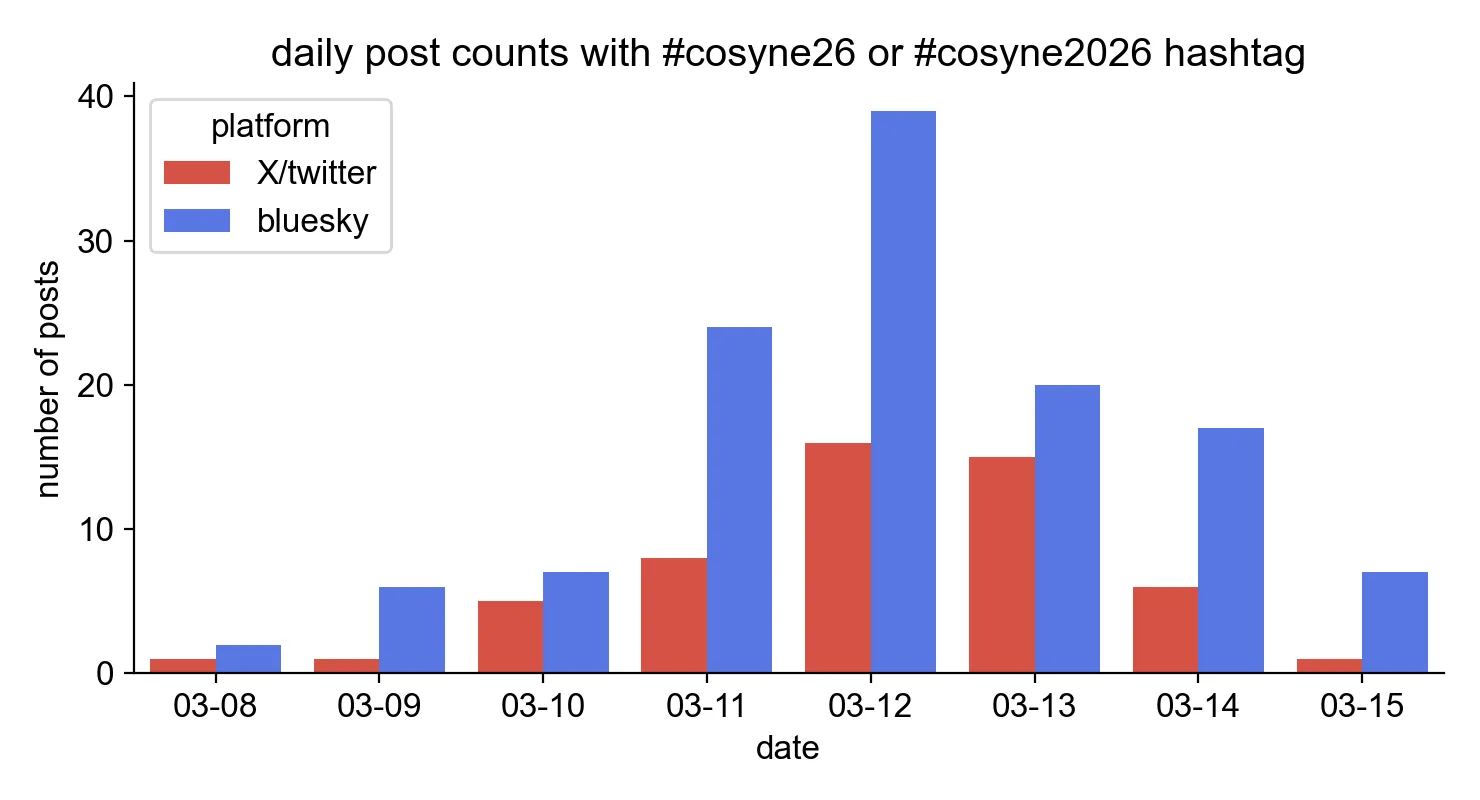
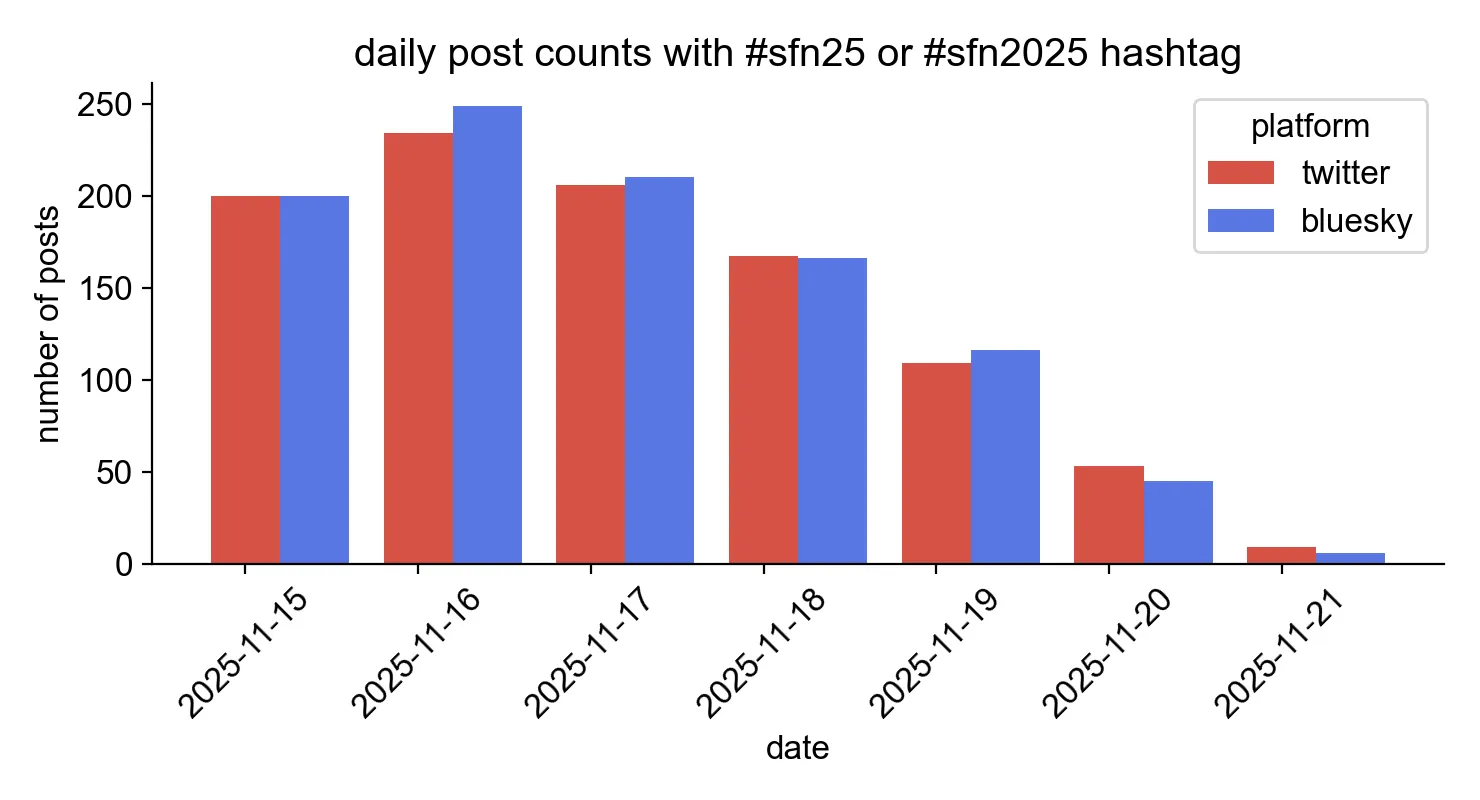
For comparison: during SfN 2025, it was fun to check the hashtag activity for #sfn25 or #sfn2025 here on Bluesky, so I wondered how it would compare to Twitter. Grabbed the number of posts for each day via the API and it seems to be pretty comparable.
(with reposts & replies excluded)
time-frequency representation of human electrocorticography data. 🌊 one axis shows frequency, the other time. the high peaks correspond to a prominent alpha rhythm at 10 Hz which appears and subsides during the experiment.
— Natalie Schaworonkow (@nschawor.bsky.social) 13 March 2026 at 17:12
[image or embed]
if you look into the activity of any brain, usually many different rhythms can be seen. is there any systematic relationship between their frequencies? there are proposals (often by physicists 🙃) that rhythms are organized according to specific ratio, e.g. the golden ratio or simply factor 2.
— Natalie Schaworonkow (@nschawor.bsky.social) 23 January 2026 at 12:22
[image or embed]