oscillations in EEG & MEEG & intracranial EEG
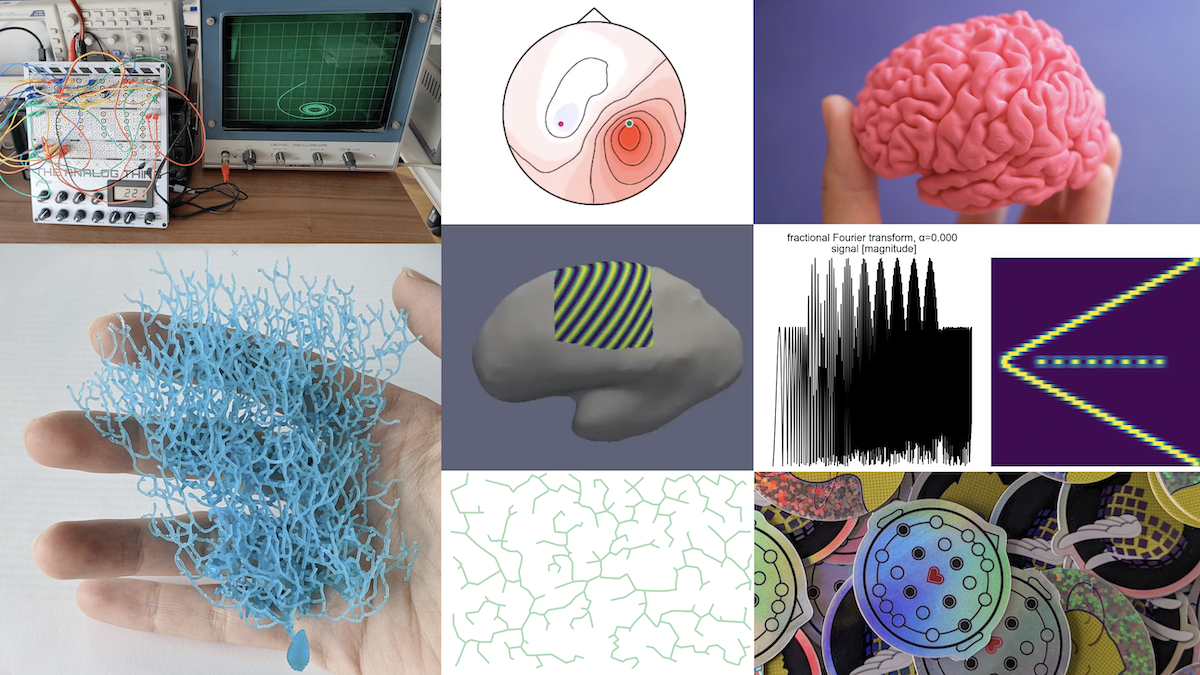
prominent oscillations in the brain recorded with 3 different recording modalities🌟(different participants, ~10 Hz rhythms) pic.twitter.com/xTg0cHOdAk
— Natalie Schaworonkow (@nschawor) December 14, 2021
prominent oscillations in the brain recorded with 3 different recording modalities🌟(different participants, ~10 Hz rhythms) pic.twitter.com/xTg0cHOdAk
— Natalie Schaworonkow (@nschawor) December 14, 2021
sound direction can be inferred from temporal differences of sound arrival at each ear. Jeffress model accomplishes this by mapping time into space with delay lines: spatially arranged units are activated depending on when inputs from both ears arrive simultaneously at the unit. pic.twitter.com/rgfHUowHH5
— Natalie Schaworonkow (@nschawor) December 8, 2021
tracking phase with a phase-locked loop: phase of a signal is compared to a reference oscillation. depending on the low-pass filtered phase difference, the reference frequency is adjusted. filter properties determine whether phase can be tracked after sudden frequency jumps. pic.twitter.com/uAqjgTmyQZ
— Natalie Schaworonkow (@nschawor) November 30, 2021
many EEG analyses are done in sensor space. in this preprint with Vadim Nikulin @MPI_CBS, we investigate how different types of alpha rhythms contribute to activity of individual EEG electrodes. https://t.co/fxPhL7sSbz 1/8 pic.twitter.com/dFrFbU5czK
— Natalie Schaworonkow (@nschawor) September 16, 2021
what happens if you apply PCA on traveling wave type activity? this will result in two phase-shifted principal components, which can be combined to reconstruct the original wave. (example for laminar LFP recordings) pic.twitter.com/3v8cXtz1t9
— Natalie Schaworonkow (@nschawor) September 8, 2021
imagine: you train a classifier to predict something from a bunch of recording electrodes. you obtain weights, 1 value for each electrode. if only 1 weight is unequal 0, does it mean the informative signal is only present on that single electrode? 🧵⬇️ pic.twitter.com/K67KboHSWl
— Natalie Schaworonkow (@nschawor) July 24, 2021
participant with such high SNR for the visual alpha-rhythm in EEG, making it possible to see the harmonic spectral peaks clearly. ♥️ pic.twitter.com/bVPWJbq4LY
— Natalie Schaworonkow (@nschawor) July 2, 2021
during a long experiment, there can be different sources of variability. for example, the participant can get sleepy, which influences measures like reaction times on a slower timescale. these slow drifts can then mask differences between experimental conditions. pic.twitter.com/kGiK78Yf02
— Natalie Schaworonkow (@nschawor) June 9, 2021
playing around with generating different kinds of waveform shapes by changing the instantaneous frequency (IF). for a sine wave, the IF is flat, phase changes linearly throughout the cycle. changing IF introduces plateaus for slower frequency & faster bends for higher frequency. pic.twitter.com/VQVEflMltJ
— Natalie Schaworonkow (@nschawor) May 4, 2021
visual hallucinations can appear in the form of specific geometrical patterns. these patterns have been related to activity waves in the visual cortex via coordinate transformation models; planar cortical waves become spirals in the visual field due to retinotopic organization. pic.twitter.com/hQuuJKumPo
— Natalie Schaworonkow (@nschawor) April 20, 2021
when analyzing LFP & spikes, only few units exhibit spike-field coupling. but there are lots of rhythms in the brain, how do they arise? this toy model here shows that only a small fraction of oscillatory units need to be active in synchrony to result in a discernible rhythm. pic.twitter.com/edrkUNiG1h
— Natalie Schaworonkow (@nschawor) April 16, 2021
spectral peaks are 1 way to assess rhythmic activity in the brain, but there are also others. below is data from my own brain, showing only a small peak exceeding 1/f-noise. but corticomuscular coherence is very high, the synchrony between EEG & contracted thumb muscle activity. pic.twitter.com/W38XFsOIkS
— Natalie Schaworonkow (@nschawor) March 23, 2021
spike-field coupling: when spikes occur at a preferred phase of an ongoing oscillation. in below example, a homogeneous Poisson spike train (spiking is distributed uniformly across time) is morphed into an inhomogeneous one, with more frequent spikes at the trough of the LFP. pic.twitter.com/xJWGMRheXz
— Natalie Schaworonkow (@nschawor) March 5, 2021
heating up a Hodgkin-Huxley model neuron. 🔥 the model is based on a squid, which lives in the cold ocean. so, no action potentials for human body temperature values. randomly read this article from Hodgkin & Katz (1949) investigating temperature & APs: https://t.co/iBqVhAtK4v pic.twitter.com/nv16AMkCQP
— Natalie Schaworonkow (@nschawor) March 11, 2021
new preprint!🌟we show how data-driven referencing can be useful for analyzing oscillations in intracranial electrophysiological recordings and explore waveform shape & spatial spread & variability across participants: https://t.co/ZZ4XUJX2b9 (1/n) pic.twitter.com/wXl2K3uVRj
— Natalie Schaworonkow (@nschawor) March 1, 2021
sometimes, there is a notion that oscillations are unspecific compared to high-frequency activity. but for below case of movement-related desynchronization, you can distinguish movement types using post-cue oscillatory power with 100% accuracy, as for high-frequency activity. pic.twitter.com/SIZDjQQemr
— Natalie Schaworonkow (@nschawor) February 24, 2021
"but the correlation is so large, it must be a robust effect" 🤔 for small samples, large values for the computed correlation coefficient are more likely to appear, even in the absence of any relationship. see here for 2 independently generated variables & different sample sizes: pic.twitter.com/bkUfOypGz2
— Natalie Schaworonkow (@nschawor) February 11, 2021
the EEG signal is a mixture of many different contributions. for example: midfrontal theta-, sensorimotor mu- and posterior alpha-rhythms, as well as muscle noise & eye blink artifacts. below, these components are added up successively onto electrode signals for illustration. pic.twitter.com/UcO0Trfn2D
— Natalie Schaworonkow (@nschawor) February 6, 2021
detrended fluctuation analysis is a method for examining variation across time scales. iteratively, the signal is split into segments of different length, calculating average standard deviation within segments for each length. this yields the so-called fluctuation function. pic.twitter.com/SwQresXCAV
— Natalie Schaworonkow (@nschawor) January 30, 2021
when fitting a regression on these values (log window length vs log fluctuation function), the slope yields the DFA exponent α, quantifying the degree of temporal correlations present. for white noise α=0.5, for brownian noise α=1.5. 🌟tutorial: https://t.co/weEmz27R9G pic.twitter.com/MmNUd1MDlT
— Natalie Schaworonkow (@nschawor) January 30, 2021
many measures depend on sufficient SNR. here, non-sinusoidal waveform shape is analyzed via the phase difference between an oscillation and its harmonic oscillation. for mu-rhythm bursts with high SNR, there is a fixed phase shift resulting in arc shape, but not for low SNR. pic.twitter.com/VA0ac2CJ1S
— Natalie Schaworonkow (@nschawor) January 23, 2021
traveling waves & sources, the empirical edition: for hippocampal theta, 2 different sources can reliably be found, which show specific phase shift. the phase extracted from raw LFP points to a traveling wave direction that is in agreement with that (here: ~top to bottom row). pic.twitter.com/91IoB97xtO
— Natalie Schaworonkow (@nschawor) January 19, 2021
two oscillatory sources, producing rhythms of same frequency. both contribute to activity of nearby electrodes with a distance-dependent weighting. changing the phase relationship of the sources changes the traveling wave direction that can be measured on the electrode signals. pic.twitter.com/9wpTQk0Qck
— Natalie Schaworonkow (@nschawor) January 4, 2021